


This is part two in a debate with liberal blogger Tim Mitchell on whether income inequality is a problem. In part one I laid out why income inequality isn’t a problem. In this post I refute arguments made in part one by Mr. Mitchell. For part two from Mr. Mitchell, click here.
In a recent post arguing that income inequality is a problem, Mr. Mitchell charges that “most American households have seen little gain in income in the last three decades despite rising productivity growth.”
He contends that from 1947-1973 there was “broad-based prosperity” because “incomes of virtually all Americans grew at around 2.5% annually.” Furthermore, he asserts, “income growth in the 1970s and 1980s was hardly noticeable and was actually negative for 60% of the population during the Bush years.”
He provides statistics from the Census Bureau and from the Piketty-Saez study to conclude that low- and middle-income earners have been left behind by the rising tide the rich have experienced over the past few decades
In his first few paragraphs, the income figures provided from the Census Bureau lead one to believe that lower- and middle-income earners have indeed been stagnant or even losing. However, as I pointed out in my original post, those income statistics don’t include benefits: pension, health insurance or subsidies (food stamps, the Earned Income Tax Credit (EITC), public housing, school lunch programs, Medicare, Medicaid, etc.).
When these things are included (total compensation) and adjustments for household size are made, it is indisputable that the lower- and middle-income earners have experienced a healthy 33 percent gain since 1979, which even progressive Stephen Rose acknowledges.
And, though I didn’t mention it in my previous post, these gains came about largely without much personal debt, as Rose explains:
“You’ve probably heard that the average U.S. household carries $9,300 in credit card debt. But that misleading statistic includes the debt of the self-employed and some small businesses. The 2004 Survey of Consumer Finances, which does not include business debt, showed that 54 percent of households had no credit card debt after paying their monthly bill and that the average household credit card debt was just over $2,300.”
But that’s not all. Census numbers (and CBO numbers) don’t take into account the equalizing effects of taxation. For example, the top 10 percent of taxpayers pay over 70 percent of the total income tax burden, even though they earn a little over 45 percent of total income. They’re paying almost one and a half times their portion. Similarly, the top 1 percent of income earners pays over 40 percent of the income tax burden, but they make slightly over 20 percent of total income. They’re paying nearly double their portion.
Meanwhile, the bottom 50 percent of tax earners pay less than 3 percent of the total income tax burden, while they earn over 13 percent of total income. They’re paying less than a quarter of their portion.
None of this is meant to say what is or isn’t fair; it is simply meant to show that taxation further balances income inequality, and needs to be taken into account when considering the debate.
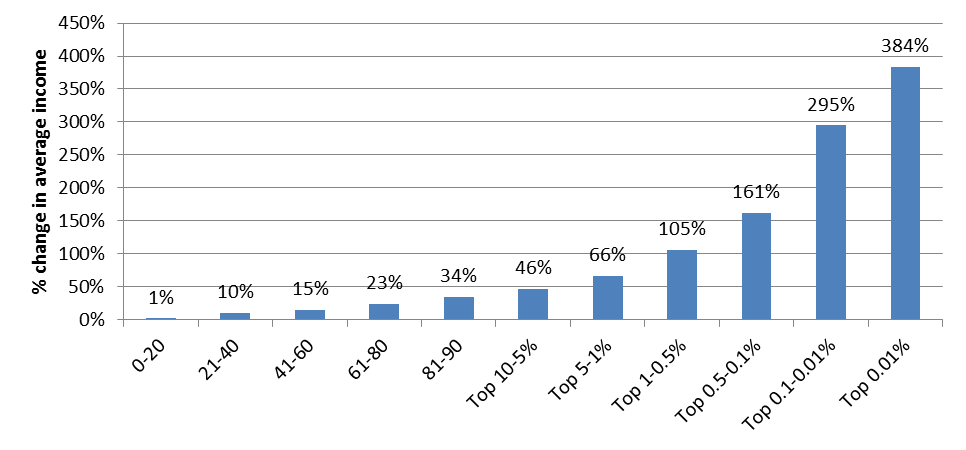
Next, note that in figure 2 Mr. Mitchell highlights “CBO data to show the percent increase in average incomes for households in select percentiles of the income distribution from 1979 to 2005 (emphasis added).” This leads him to conclude that “the top 0.01% of households … saw their average incomes rise nearly five-fold over the last three decades, more than the percentage increase in the average incomes of the bottom 99.5% combined.”
Yet, as I argued, using average income statistics deflate lower- and middle-class incomes, but inflate upper-class incomes. A large increase in immigration during the 80s and 90s meant an increase in low-skilled labor (and therefore low wages), bringing the average income level of the lower- and middle-class down. Also, there has been a rise in single-parent households, particularly inflicting the middle-class, again dragging middle-class average income down. But median income statistics adjust for this, which is why they accurately capture the income gains the middle- and lower-class have made.

Additionally, Mr. Mitchell later goes on to provide a CBO graph. Notice that the numbers in each segment of the various income groups, however, are unequal. This amplifies economic inequality. When equalized, the graph flattens out a bit:
Lastly, as I’ve stressed, income inequality tells one nothing about the economic state of the poor-, middle-, or upper-class. In fact, incomes are not a good indicator of overall wealth, which is a much broader and more thorough measure of prosperity.
The Federal Reserve defines wealth as “all financial and nonfinancial assets, including bank accounts, investments, houses, cars and debt.” And, as G. William Domhoff’s (a noted liberal professor at The University of California, who’s very much concerned with income inequality) study shows, the overall wealth distribution has not changed since 1922:

And:
| Bottom 99 percent | Top 1 percent | |
| 1922 | 63.3% | 36.7% |
| 1929 | 55.8% | 44.2% |
| 1933 | 66.7% | 33.3% |
| 1939 | 63.6% | 36.4% |
| 1945 | 70.2% | 29.8% |
| 1949 | 72.9% | 27.1% |
| 1953 | 68.8% | 31.2% |
| 1962 | 68.2% | 31.8% |
| 1965 | 65.6% | 34.4% |
| 1969 | 68.9% | 31.1% |
| 1972 | 70.9% | 29.1% |
| 1976 | 80.1% | 19.9% |
| 1979 | 79.5% | 20.5% |
| 1981 | 75.2% | 24.8% |
| 1983 | 69.1% | 30.9% |
| 1986 | 68.1% | 31.9% |
| 1989 | 64.3% | 35.7% |
| 1992 | 62.8% | 37.2% |
| 1995 | 61.5% | 38.5% |
| 1998 | 61.9% | 38.1% |
| 2001 | 66.6% | 33.4% |
| 2004 | 65.7% | 34.3% |
| 2007 | 65.4% | 34.6% |
| Sources: 1922-1989 data from Wolff (1996). 1992-2007 data from Wolff (2010). |
So not only do accurate income statistics demonstrate that lower- and middle-class incomes have increased significantly, but in terms of wealth, inequality has not gotten worse, going back as far as the record documents (the worst wealth disparity was in 1995, under President Clinton).
In sum, Mr. Mitchell’s argument relies upon incomplete statistics: Census and CBO numbers exclude benefits, pension and subsidies. Consequently, after adjusting for these, the notion that any income group hasn’t benefitted healthily from the “rising tide” is a myth, as responsible statistics unmistakably refute.
Second, the Census and CBO numbers don’t account for taxation, which makes economic inequality appear much worse than it is. Upper-income earners pay a much larger share of the tax burden, which further evens the playing field. Meanwhile, subsidies and programs like food stamps and EITC, which tend to benefit many in the middle- and lower-class, aren’t counted as income, even though the EITC is one of the largest anti-poverty programs we have.
And finally, there has been no increase in wealth inequality, which is a more comprehensive measure of prosperity.
Therefore, given that total compensation has gone up, along with purchasing power and standard of living, all while wealth concentration has been relatively constant, how can one conclude anything other than that prosperity has broadly been shared?